

- Messages
- Profiles
- Business
Model - Management Discussion
and Analysis - Stewardship
- Integrated Risk Management
- Corporate Governance
- Annual Report of the Board of Directors on the Affairs of the Bank
- Report of the Audit Committee
- Report of the Human Resources and Remuneration Committee
- Report of the Nomination and Governance Committee
- Report of the Board Integrated Risk Management Committee
- Report of the Credit Approval Committee
- Report of the Related Party Transactions Review Committee
- Directors’ Statement on Internal Control
- Independent Assurance Report
- Investor
Relations - Financial
Reports- Financial Calendar
- Statement of Directors’ Responsibilities in Relation to Financial Statements
- Chief Executive’s and Chief Financial Officer’s Statement of Responsibility
- Independent Auditors’ Report
- Income Statement
- Statement of Profit or Loss and other Comprehensive Income
- Statement of Financial Position
- Statement of Changes in Equity
- Statement of Cash Flows
- Notes to the Financial Statements
- Other Disclosures
- Supplementary
Information
Management Discussion and Analysis


Value Creation and External Capital Formation
EMPLOYEE CAPITAL
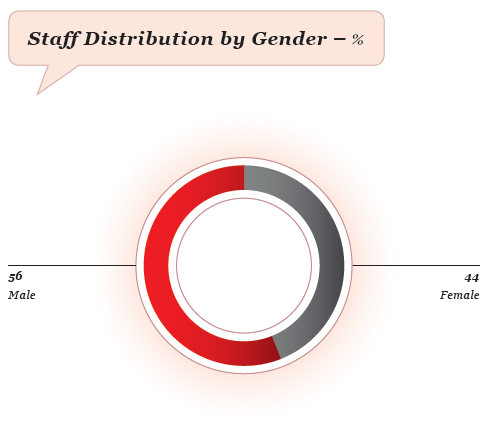
DFCC Bank grew its Human Capital base to 1,770 in 2017 – an increase of 7% over 2016 - with permanent employees accounting for 80%. The gender distribution ratio, stood at 56:44 (male to female), whilst in relation to age distribution, employees under 30 years of age comprise 57.6% of the overall headcount.
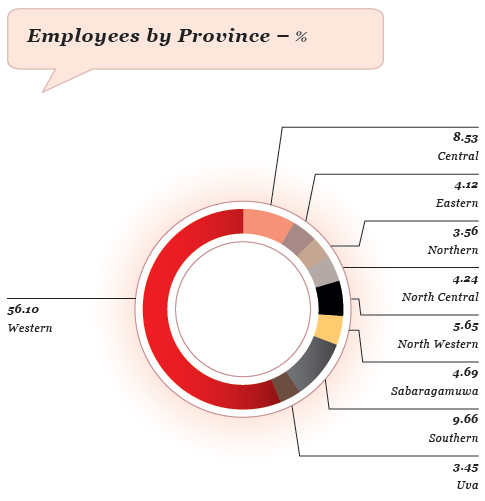
56% of employees were stationed in the Western Province, followed by 9.7% in the Southern Province and 8.5% in the Central Province. The Northern and Eastern Provinces, with 10 branches accounted for 8% of the
total workforce.
Staff Analysis
Workforce by Employment Type/Contract and Gender
| Permanent | Contract/Casual/Part time | Total Number of Employees | ||||||||||||||||
| Grade | Male | Female | Total | Male | Female | Total | Male | Female | Total | |||||||||
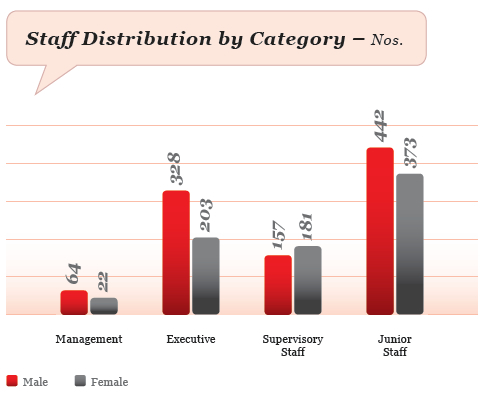
| Management | 53 | 19 | 72 | 11 | 3 | 14 | 64 | 22 | 86 | |||||||||
| Executive | 295 | 190 | 485 | 33 | 13 | 46 | 328 | 203 | 531 | |||||||||
| Supervisory Staff | 156 | 181 | 337 | 1 | 0 | 1 | 157 | 181 | 338 | |||||||||
| Junior Staff | 246 | 269 | 515 | 196 | 104 | 300 | 442 | 373 | 815 | |||||||||
| Total | 750 | 659 | 1,409 | 241 | 120 | 361 | 991 | 779 | 1,770 | |||||||||
Total Workforce by Region and Gender
| 2017 December | 2016 December | 2015 December | ||||||||||||||||
| No. of Employees | No. of Employees | No. of Employees | ||||||||||||||||
| Province/Departments and Other Business Units | No. of Branches/ Departments | No. of SLP Units | Male | Female | Total | No. of Branches/ Departments | No. of SLP Units | Male | Female | Total | No. of Branches/ Departments | No. of SLP Units | Male | Female | Total | |||
| Central | 13 | 2 | 105 | 46 | 151 | 11 | 4 | 95 | 45 | 140 | 10 | 4 | 69 | 47 | 116 | |||
| Eastern | 8 | 2 | 55 | 18 | 73 | 8 | 2 | 52 | 21 | 73 | 7 | 4 | 50 | 22 | 72 | |||
| Northern | 6 | 0 | 39 | 24 | 63 | 6 | 0 | 38 | 23 | 61 | 6 | 0 | 34 | 21 | 55 | |||
| North-Central | 6 | 3 | 52 | 23 | 75 | 6 | 3 | 50 | 25 | 75 | 3 | 6 | 42 | 20 | 62 | |||
| North-Western | 9 | 2 | 58 | 42 | 100 | 7 | 3 | 51 | 46 | 97 | 6 | 4 | 36 | 38 | 74 | |||
| Sabaragamuwa | 7 | 8 | 48 | 35 | 83 | 7 | 8 | 43 | 40 | 83 | 5 | 10 | 36 | 35 | 71 | |||
| Southern | 15 | 8 | 98 | 73 | 171 | 9 | 14 | 72 | 73 | 145 | 9 | 14 | 67 | 67 | 134 | |||
| Uva | 4 | 5 | 40 | 21 | 61 | 4 | 5 | 38 | 19 | 57 | 4 | 5 | 38 | 18 | 56 | |||
| Western | 33 | 7 | 213 | 192 | 405 | 32 | 8 | 185 | 188 | 373 | 29 | 11 | 146 | 176 | 322 | |||
| Departments and Other Business Units |
76 | 0 | 283 | 305 | 588 | 69 | 0 | 250 | 288 | 538 | 63 | 0 | 208 | 275 | 483 | |||
| Total | 177 | 37 | 991 | 779 | 1,770 | 159 | 47 | 874 | 768 | 1,642 | 142 | 58 | 726 | 719 | 1,445 | |||
Note : Number of staff attached to Regional offices are included with respective province staff count
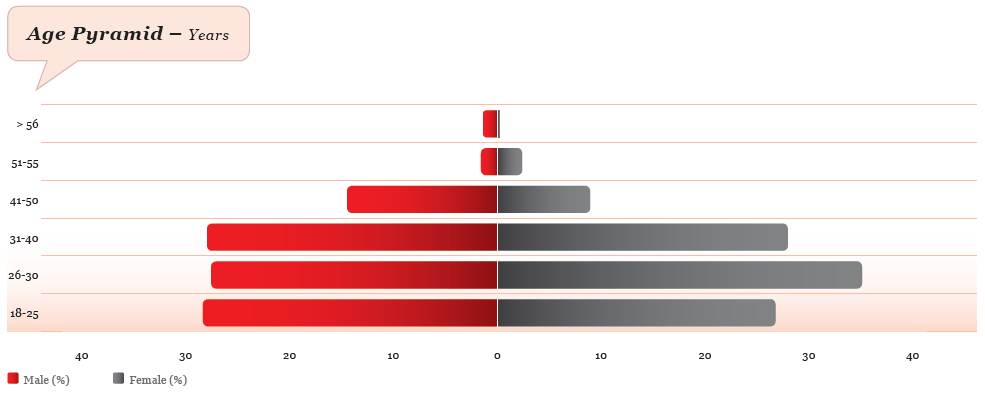
Workforce by Age and Category
| Management | Executive | Supervisory | Junior Staff | |||||||||||||
| Grade | Count | % | Count | % | Count | % | Count | % | ||||||||
| 18-25 | 0 | 0 | 12 | 2 | 1 | 0 | 469 | 58 | ||||||||
| 26-30 | 0 | 0 | 143 | 27 | 121 | 36 | 275 | 34 | ||||||||
| 31-40 | 8 | 9 | 267 | 50 | 169 | 50 | 45 | 6 | ||||||||
| 41-50 | 53 | 62 | 99 | 19 | 40 | 12 | 18 | 2 | ||||||||
| 51-55 | 16 | 19 | 8 | 2 | 6 | 2 | 4 | 0 | ||||||||
| 56 + | 9 | 10 | 2 | 0 | 1 | 0 | 4 | 0 | ||||||||
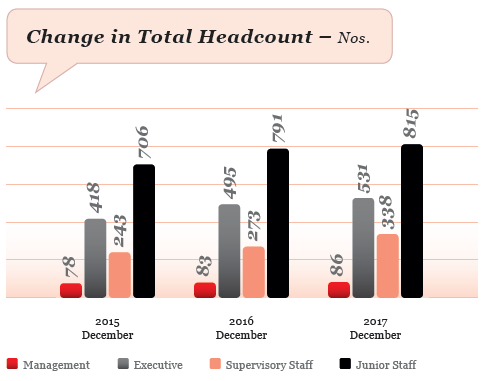
| Total | 86 | 100 | 531 | 100 | 338 | 100 | 815 | 100 | ||||||||
Development and Growth
As per the Bank’s emphasis on investing in employees, extensive opportunities to receive training and development were provided during the year.
| No. of person hours of training | ||||||
| Grade | Male | Female | Total | |||
| Management | 2,031 | 590 | 2,620 | |||
| Executive | 11,806 | 7,191 | 18,997 | |||
| Non-Executive | 16,298 | 13,198 | 29,496 | |||
| Total | 30,134 | 20,979 | 51,113 | |||
* Excluding e-learning
| Total person hours 2017 | ||
| In house | 46,211 | |
| External | 4,306 | |
| Foreign | 596 | |
| E-learning | 21,552 | |
| Total | 72,665 |
Development needs are identified via different means, including:
- Individual development plans prepared by supervisors upon discussion with their employees
- Discussions with cross functional groups
- Discussions with business heads
Once identified, the needs are addressed through:
- Provision of classroom-based training opportunities (domestic and overseas)
- On-the-job training
- Job rotations
- Role enhancements
- Special assignments
- e-learning opportunities
The Bank’s e-learning platform which offers relevant business and soft skill-based content, was widely used to deliver knowledge to employees across the country as well as conduct assessments and quizzes to ensure an effective and fun learning experience. Usage of the platform grew by 22%. User satisfaction was aptly demonstrated at the annual survey which noted that 99% of users were highly satisfied with the facility provided.
In 2017, 404 training programmes were conducted of which 178 were conducted in-house – a 22% increase over the previous year’s in-house offerings. Nearly 72,700 hours of training were provided during the year, with employees receiving an average of 42.6 hours.
Improving the continuous development and progression of employees remained a priority for the Bank. During the year, 70 junior level employees underwent the Officer in Charge (OIC) Certification Programme, with 47 participants successfully completing the stringent course, a prerequisite to perform an OIC role at the Bank. Since its inception, 161 employees have being successfully certified. A Credit Certification Programme, was introduced this year to assist junior level staff to embark on a career path in credit, with 24 staff participating in the seven day programme, and 50% successfully completing the certification process.
The individual-focused career development programmes, “Ascension” (targeting high potential staff) and “Rise” (aimed at staff requiring focused assistance to perform at expected levels), continued to be rolled out in 2017. Currently 32 employees are participating in the Ascension programme, and 16 employees in the Rise programme.
The re-skilling programme, introduced in 2016, aims to enable mature employees, whose job roles have changed based on business needs, to acquire the relevant knowledge and skills required to perform their new roles optimally. The programme continued to be rolled out in 2017 with progress regularly monitored and interventions made when necessary. With this focused attention it is noteworthy that 12 of the 46 participating employees left the programme, having achieved their expected performance levels.
Coaching and mentoring initiatives were offered to employees, based on individual needs during the year. Additionally, new employees were assisted to assimilate quicker into the work environment through on-boarding programmes and the “Buddy Scheme”. The Buddy Scheme sees senior colleagues act as buddies to the new recruits, helping them to understand the Bank culture, policies, practices, and the expectations of their job roles. Further demonstrating continued commitment towards assisting employees with their personal and professional ambitions, the Bank offers varied assistance and grant schemes for higher education. During the year under review, 156 employees took advantage of these schemes.
Recruitment and Retention
Recruitment
During 2017, the employee base grew by 319, necessitated by the continued expansion of the branch network and introduction of new business offerings and services. Of the new recruits, 68% were for junior level positions, while 78% of them were under the age of 30. The Bank maintained its commitment to having internal talent groomed to take on more responsibility in the future, with only one external recruitment being made to a management position during the year. Resourcing talent with the desired level of competency and the right fit continued to be a key HR challenge during the year, with sales roles being particularly challenging to fill despite attractive incentive schemes and the availability of dedicated and progressive career paths.
| New Employees Joining in the Current Financial Year | ||||||||||||||
| Grade | Age Group | Gender | ||||||||||||
| Less than 30 Years | Between 30-50 Years | Above 50 Years | Total | Male | Female | Total | ||||||||
| Management | 0 | 1 | 0 | 1 | 1 | 0 | 1 | |||||||
| Executive | 33 | 41 | 0 | 74 | 59 | 15 | 74 | |||||||
| Supervisory Staff | 10 | 15 | 0 | 25 | 22 | 3 | 25 | |||||||
| Junior Staff | 205 | 12 | 2 | 219 | 163 | 56 | 219 | |||||||
| Total | 248 | 69 | 2 | 319 | 245 | 74 | 319 | |||||||
2017 saw 66% of new hires sourced for branches, with the majority of hires to the Southern Province, as six of the 14 new branches opened during the year were in this region.
New Hires by Province
| Province | Total | |
| Central | 23 | |
| East | 10 | |
| North | 9 | |
| North-Central | 13 | |
| North-Western | 14 | |
| Sabaragamuwa | 19 | |
| South | 43 | |
| Uva | 14 | |
| Western | 174 | |
| Total | 319 |
Retention
83 permanent employees voluntarily resigned during the year, 42% of whom were junior staff. Retention of sales staff continued to be a challenge, with the year seeing 52 such staff leaving the Bank. Exit interviews are conducted for resigning permanent staff members, with appropriate feedback given to their supervisors and other corrective actions taken, if warranted. The Operations Risk Management Committee reviews attrition data on a quarterly basis, highlighting the importance of human capital to the Bank. The attrition rate of permanent employees in 2017 was to 6.1%.
Total Number and Percentage of Employee Turnover by Age Group and Gender
| 2017 December | 2016 December | 2015 December | |||||||||||||
| Category | Employee Turnover | %* | Employee Turnover | %* | Employee Turnover | %* | |||||||||
| Male | Female | Male | Female | Male | Female | Male | Female | Male | Female | Male | Female | ||||
| Below 30 Years | 20 | 19 | 7 | 6 | 23 | 19 | 8 | 6 | 20 | 28 | 7 | 8 | |||
| 30 – 50 Years | 23 | 21 | 5 | 6 | 20 | 15 | 5 | 5 | 19 | 14 | 6 | 5 | |||
| 51 – 60 Years | 0 | 0 | 0 | 0 | 2 | 0 | 13 | 0 | 0 | 1 | 0 | 11 | |||
| Above 60 | 0 | 0 | 0 | 0 | 0 | 0 | 0 | 0 | 0 | 0 | 0 | 0 | |||
| Total | 43 | 40 | 6 | 6 | 45 | 34 | 7 | 5 | 39 | 43 | 6 | 7 | |||
* As a percentage of total male/female staff in each employee category in the permanent cadre
Number of Employees Resigned
| Category | Age Group | Gender | ||||||||||||
| Less than 30 Years | Between 30-50 Years | Above 50 Years | Total | Male | Female | Total | ||||||||
| Management | 0 | 1 | 0 | 1 | 1 | 0 | 1 | |||||||
| Executive | 5 | 23 | 0 | 28 | 14 | 14 | 28 | |||||||
| Supervisory Staff | 5 | 14 | 0 | 19 | 9 | 10 | 19 | |||||||
| Junior Staff | 29 | 6 | 0 | 35 | 19 | 16 | 35 | |||||||
| Total | 39 | 44 | 0 | 83 | 43 | 40 | 83 | |||||||
Resignations by Province
| Province | Total | |
| Central | 5 | |
| East | 0 | |
| North | 3 | |
| North-Central | 5 | |
| North-Western | 5 | |
| Sabaragamuwa | 3 | |
| South | 8 | |
| Uva | 2 | |
| Western | 52 | |
| Total | 83 |
Return to Work after Parental Leave
| Indicator | Male | Female | Total | |||
| Number of employees entitled to parental leave during previous reporting period (2016) |
n/a | 768 | 768 | |||
| Number of employees who took parental leave and due to return during 2017 | n/a | 59 | 59 | |||
| Number of employees who returned to work after parental leave during 2017 | n/a | 57 | 57 | |||
| Employees who returned to work out of those due to return during 2017 | n/a | 97% | 97% | |||
| Number of employees due to return to work after parental leave during 2016 | n/a | 67 | 67 | |||
| Number of employees who returned to work after parental leave during 2016 | n/a | 66 | 66 | |||
| Employees who returned to work out of those due to return during 2016 | n/a | 99% | 99% | |||
| Number of employees who returned to work after parental leave during 2016, who were still employed 12 months after return to work | n/a | 58 | 58 | |||
| Retention rate | n/a | 87% | 87% |
Benefits
| Employment Type | Permanent | Contract | ||
| Housing Loan | √ | x | ||
| Vehicle Loan | √ | x | ||
| Exam* | √ | x | ||
| Professional Subscription* | √ | x | ||
| Social Club Gymnasium* | √ | x | ||
| Miscellaneous/Staff Loan | √ | x | ||
| Festival Advance** | √ | x | ||
| MBA Loan | √ | x | ||
| Holiday Grant*** | √ | x |
* Executive Trainees and Management Trainees on fixed term contracts will also be provided
** Only for non-executive staff
*** Based on the offer of employment, may be provided to the contract staff as well
Performance Management
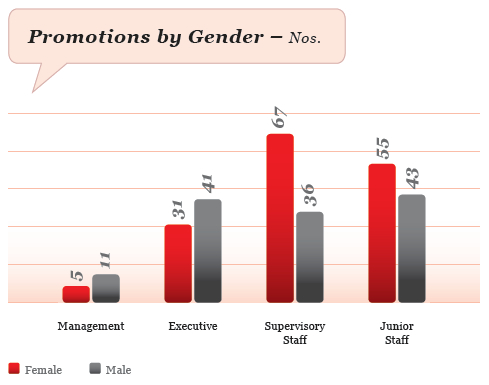
Performance management continued to have key focus. Formal performance reviews were conducted mid-year and year-end, although supervisors are encouraged to conduct more frequent reviews. At the year-end evaluation, based on achievement of targets, employees are individually assessed and performance based bonus and annual increments awarded. The performance assessments are affiliated to the promotion mechanisms of the Bank as well.
Employees also have the option to escalate their concerns, in the case of disagreement over the performance evaluation, to the HR department, the Grievance Committee, and even the CEO.
Work Life Integration
DFCC Bank promotes work life integration and an environment which encourages staff to participate in extra-curricular hobbies and passions outside of their job scopes. To this end, groups such as the Welfare and Recreation Club, DFCC Reds, Mess Committee, and DFCC Community Projects Team organised different initiatives throughout the year, aimed at promoting interaction among employees and their families, enhancing health and wellness, and providing employees with opportunities to contribute to the larger community.
This year’s annual dance witnessed its largest patronage yet, with 1,300 employees and their families participating. Events such as overnight trips, the sports day, cricket matches, the Christmas party and carols, quiz nights, and mess nights provided employees with a multitude of opportunities to mix and mingle.
Focus continued to be placed on employee wellness, with programmes being held on non-communicable diseases, health and fitness and advice on nutrition, exercise, and mental wellness also being regularly disseminated. Activities, including hiking trips, yoga classes, a pedometer challenge, a six-month boot camp programme, and a free medical camp for staff were organised throughout the year. The Bank continued to invest in sports activities such as basketball, badminton, and tennis, while also sponsoring employees to participate in local and international sports competitions. The Bank also provides fully and partially sponsored gym and social club memberships, a benefit utilised by 195 employees during the year.
In keeping with one of the Bank’s core values of being “socially responsible”, employees participated in many events including an annual blood drive, a beach clean-up, donations to orphanages, a fully funded day out for 60 students from an underprivileged school and a public eye donation campaign conducted on behalf of the National Eye Bank of Sri Lanka with over 300 donors signing up. The DFCC Reds closed the year’s employee-initiated
CSR projects by organising school supplies to assist children from underprivileged backgrounds. When significant segments of the community were impacted by inclement weather, the Bank carried out disaster relief efforts with the active engagement of the staff. The Bank, along with its employees, generously donated funds to assist impacted colleagues and the larger community. Employees also contributed their time and effort to prepare ration packs for victims, assist at medical camps organised by the Bank in Akuressa and Deniyaya, and contributed towards the clean up and reconstruction efforts of six affected schools.
| 1,770 Total headcount in 2017 |
||
| 319 new recruitments in 2017 |
||
| 72,700 hours of staff training |
||
| Over 1,100 merchants connected to the DFCC Virtual Wallet |
||
| Over 250 global correspondent banks |
Grievance Redressal
DFCC Bank’s employees have many avenues through which they can raise concerns and seek redressal. The
Board-approved Grievance Policy outlines the grievance escalation process, while a Grievance Committee, comprising cross-functional representation of employees, is available to raise concerns. The Bank’s secure Environment Policy clearly outlines and advocates for a harassment-free environment that provides equal opportunities for all, and outlines mechanisms and options to address issues.
The “Reach Out” programme, launched during the latter part of 2016, provides a platform for female employees to seek assistance on personal and professional issues that affect them. Periodically organised open days with the Chairman and CEO, and access to their dedicated phone lines and email addresses give employees access to the highest level to address their grievances.
A majority of the grievances raised during the year pertained to transfers, performance evaluations, and promotions. The Grievance Committee held quarterly meetings to discuss common issues raised with them and receive updates on issues raised with HR. Grievances received under the Reach Out programme were all appropriately addressed.
Thanking and Rewarding
The Bank recognises the pivotal role of appreciation and recognition towards employee engagement, productivity, and retention. Several programmes are offered to promote these aspects within the Bank’s workplace ethos.
Through the “Rewarding Excellence” scheme introduced in 2013, the special and extra contributions of employees continue to be recognised – the achievements of 41 employees were celebrated during the year with active participation from members of the Board of Directors and senior management. Since the inception of the scheme, 113 employees have been recognised and rewarded.
An “Appreciation Night” was held in 2017 to thank over a hundred employees who regularly and voluntarily took on additional roles and responsibilities for which they are not monetarily compensated. An “Awards Night” was introduced for the first time in 2017, with employees recognised for business and sales performance, and awards given for excellence in areas such as sports, customer service, volunteering, and many other aspects.
An e-card platform was introduced this year to provide employees with a quick and convenient system to recognise and appreciate specific contributions of their colleagues, subordinates, and supervisors.
Embracing Diversity, Inclusion and Equality
The Bank has strived to ensure fair and equitable workplace policies and practices, irrespective of gender, cultural or religious diversity. The tables below demonstrate the Bank’s commitment towards ensuring equitability.
Ratio of Salary of Men to Women by Employee Category
| 2017 | ||||||||
| Male | Female | Total | Basic Salary ratio, Male/Female | |||||
| Management | 64 | 22 | 86 | 46:54 | ||||
| Executive | 328 | 203 | 531 | 51:49 | ||||
| Supervisor | 157 | 181 | 338 | 51:49 | ||||
| Junior Staff | 442 | 373 | 815 | 49:51 | ||||
| Total | 991 | 779 | 1,770 | 49:51 | ||||
Recognition and celebration of cultural diversity was demonstrated throughout the year, with employees organising and celebrating multi-religious and cultural events, and enthusiastically decorating their workspaces to commemorate these events, irrespective of their own personal religious and cultural affiliations.
Occupational Safety
DFCC Bank is committed towards occupational safety and measures are in place to prevent accidents and injuries in the workplace. Due to the nature of the work, the Bank employees are not generally subject to major injuries or hazardous substances. All premises of the Bank are considered non-smoking zones. The Bank also takes measures to regularly educate employees on occupational safety, health and related subjects. In 2017, programmes were conducted on first aid and fire evacuation while employees continued to be educated on how to deal with unplanned events. Two employees experienced minor injuries in the workplace, and the Bank responded by implementing measures to rectify the situation and ensure that such situations would not recur.
Collective Agreements
Due to the absence of employee unions, the Bank does not have a requirement for collective agreements. Market surveys are conducted every three years, as per the Remuneration Policy, to benchmark employee remuneration levels against that of competitors. Based on survey feedback and affordability considerations, adjustments are made to salary and benefits.